
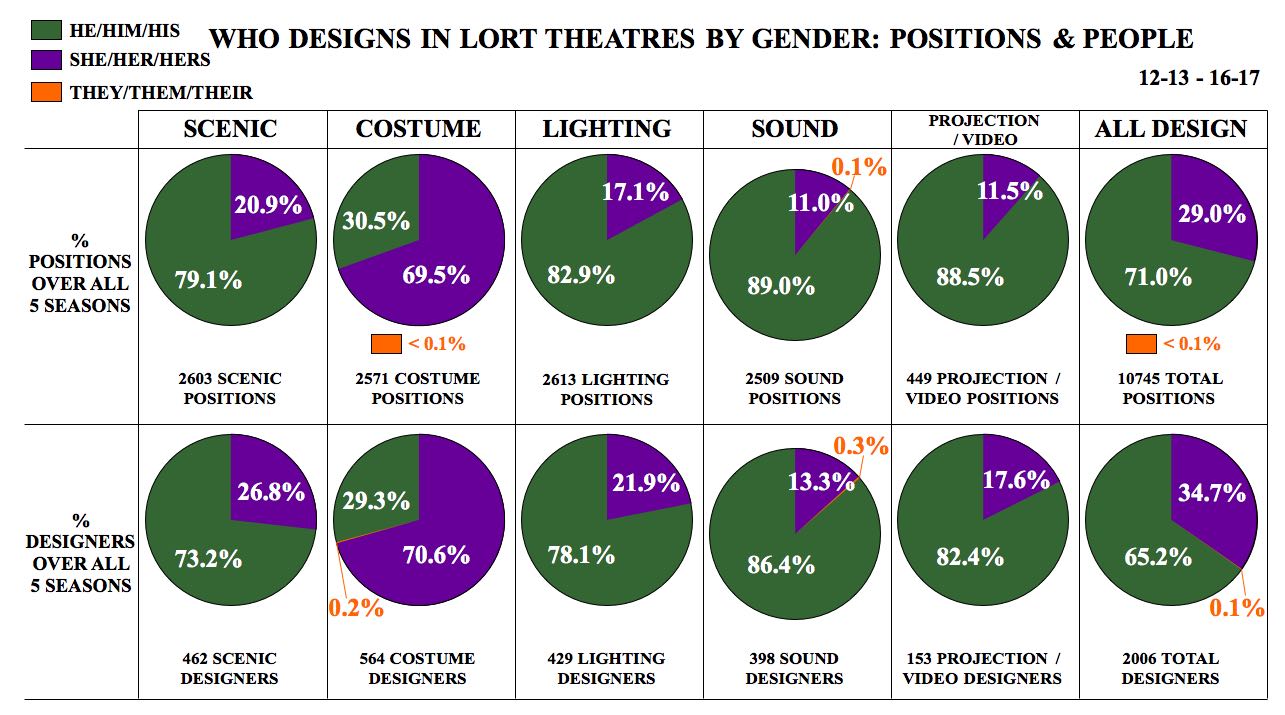
I first published this study in 2015, hoping to provide a baseline on gender of designers in League of Resident Theatre (LORT) Theatres. This article and the accompanying charts are the result of the last five years of collecting, confirming whenever possible, and analyzing the data. The chart in the original study looked at the 2009-2010 through 2013-2014 seasons, whereas these represent 2012-2013 through 2016-2017. Overall, there is very little change between each five-season set of the statistics (there are two seasons shared between them)—rarely more than a percentage or two. The biggest change is that in the first study, female lighting designers held 13.7 percent of the positions, and in this latest study, they held 17.1 percent. This is the largest growth. Overall, women held 28.2 percent of all design positions in my first study, and hold 29 percent in this latest one.
I find these results unsurprising, but disappointing for the American theatre, as we have been talking about gender equity for a long time. Meaningful change takes time and deliberate, thoughtful choices that reflect the values professed by many mission statements. We have a lot of work left to do, so let's get down to doing it.
Overall, women held 28.2 percent of all design positions in my first study, and hold 29 percent in this latest one.
Methodology
I collected data primarily from the theatres’ own websites, TCG Member Profiles, BroadwayWorld.com, Playbill.com, and various newspaper and internet review sites. Then I wrote the theatres directly with the data I collected, and asked for confirmation and/or correction. I excluded the following: tours, events, galas, Theatre for Young Audiences shows, and any production that was presented rather than produced.
In cases where theatres run their seasons yearly, the 2013 season was combined with the 2012-13 season for statistical purposes, and so forth. I collected data and then sent what I found to the theatres themselves for confirmation. Only lead designers, no assistants or associates, were counted. In cases where multiple designers worked as co-designers, they each got partial credit. For example, Joe and Jane were the co-scenic designers of a production, so they each received 0.5 in the designer counting. People were counted as individual designers in each discipline, even if they designed in two or more disciplines. And of course, as always, correlation is not causation.
Many designers and directors work both inside LORT member theatres and elsewhere. This study does not suggest that the numbers below reflect the totality of an individual’s work for the five seasons. Although there are some resident designer jobs, the vast majority of design positions do not go to resident designers, and I have not made a distinction between resident and freelance designers in this study.
In determining gender identity, I read production bios and used whatever personal pronoun I found. When a designer used gender-neutral pronouns, that is noted on the graphs and charts under “they designers.” There’s no elegant and short way yet to say “designers-whose-pronouns-are-‘he’ designers” so for the purposes of this article, I’m going to say “he designers,” “she designers,” and “they designers,” and same for artistic directors and directors.
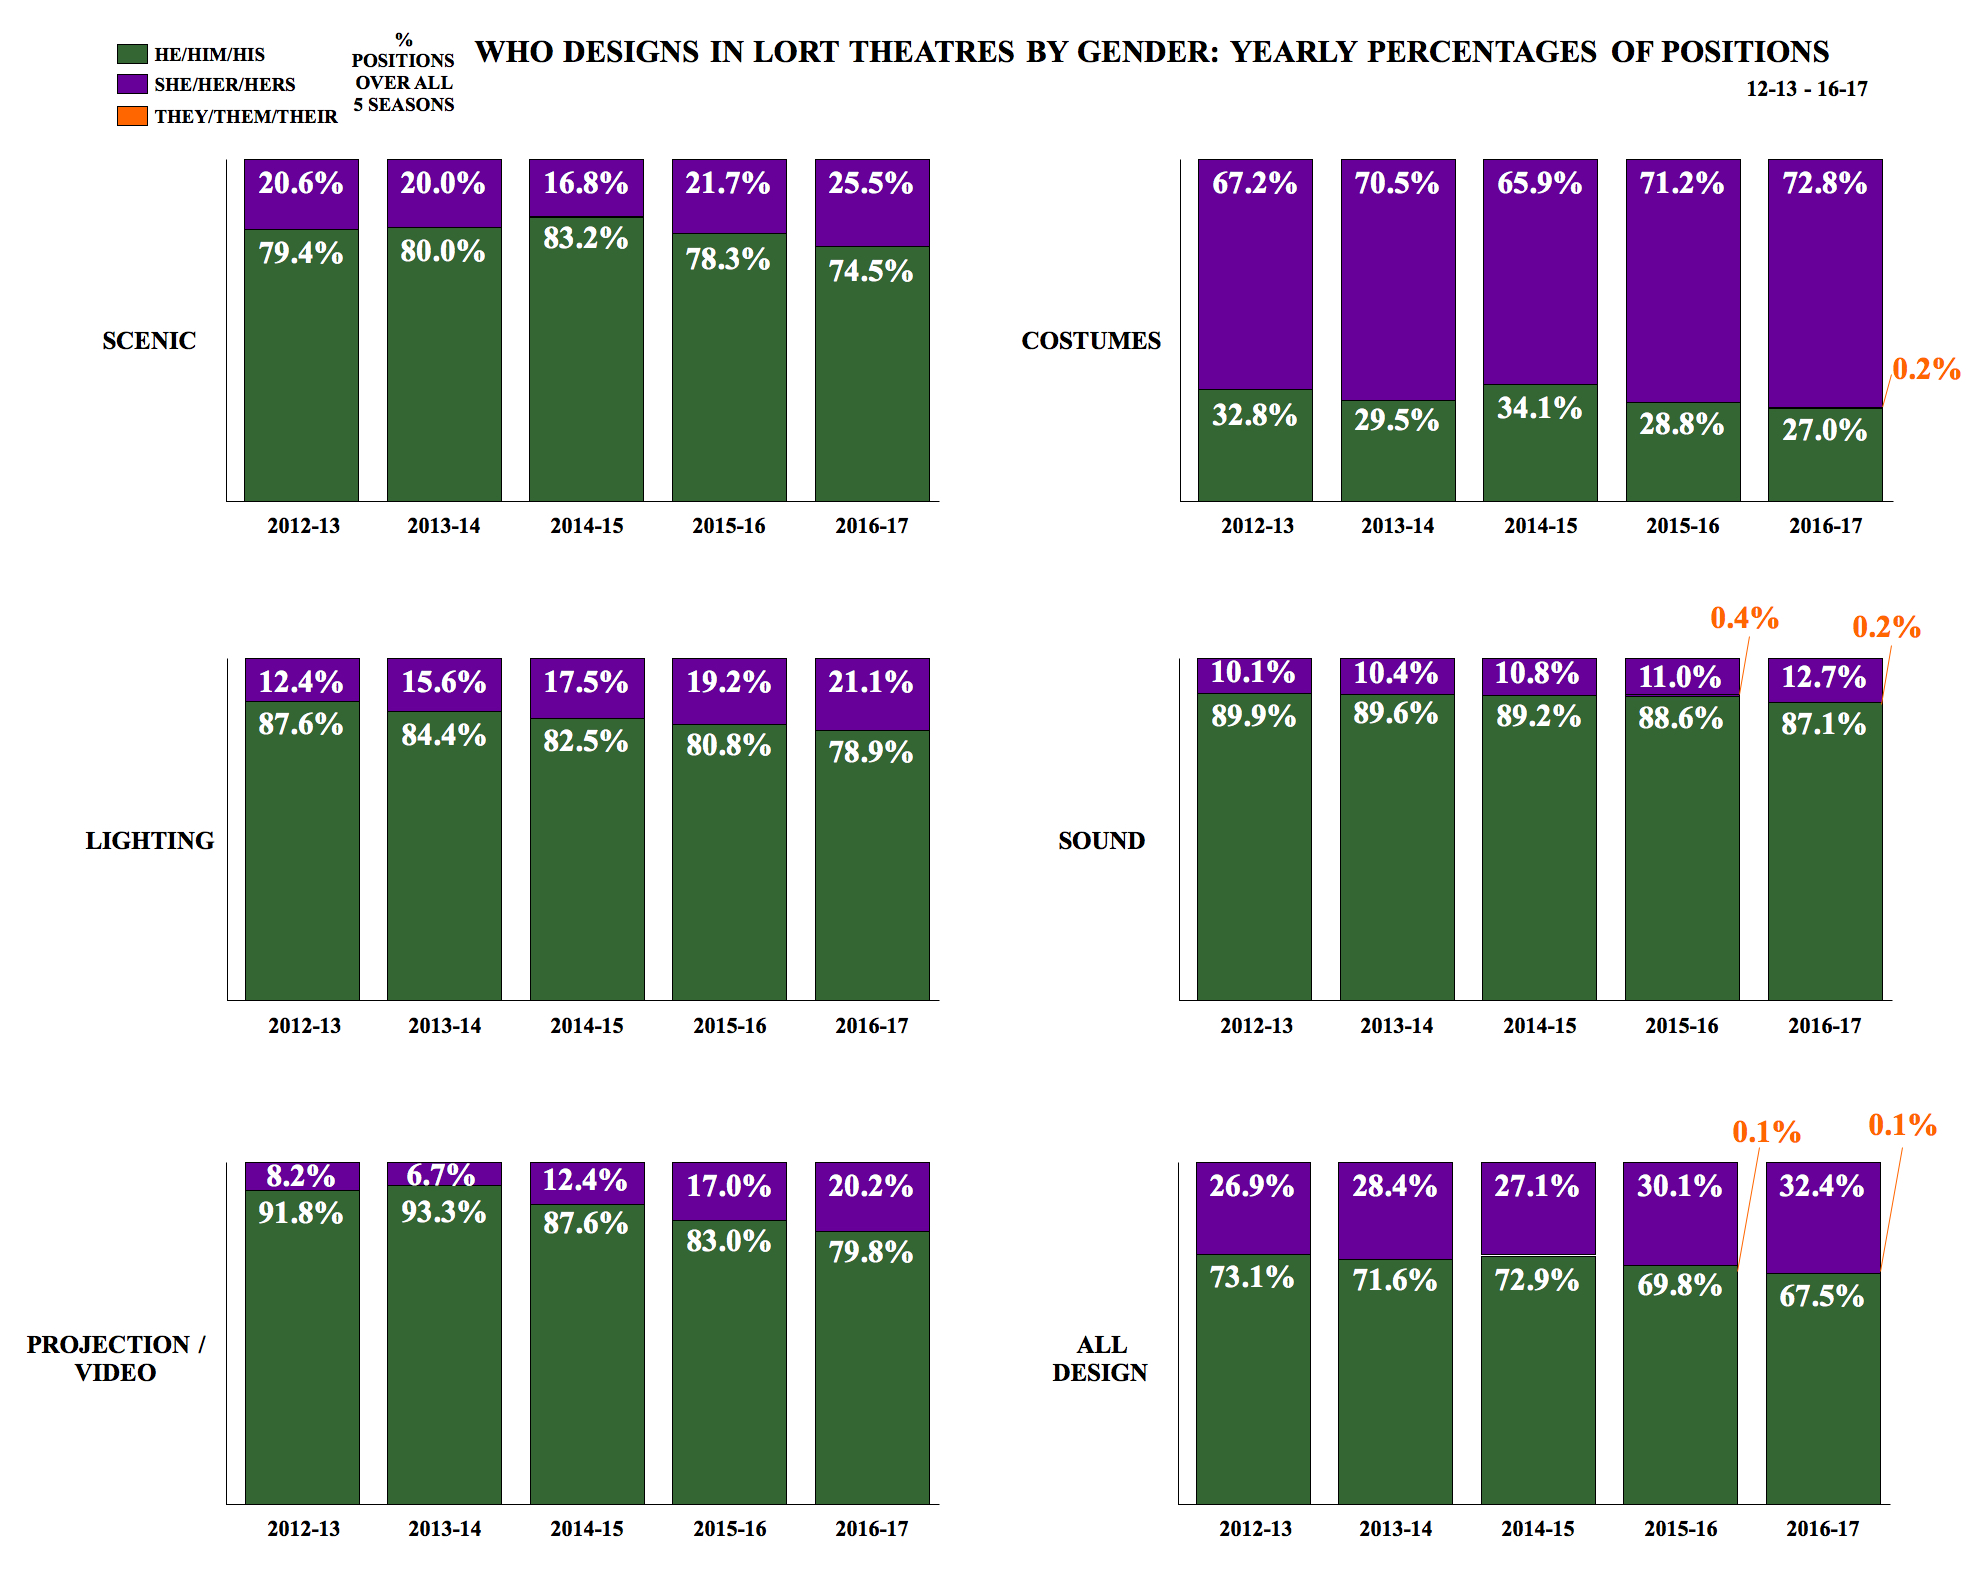
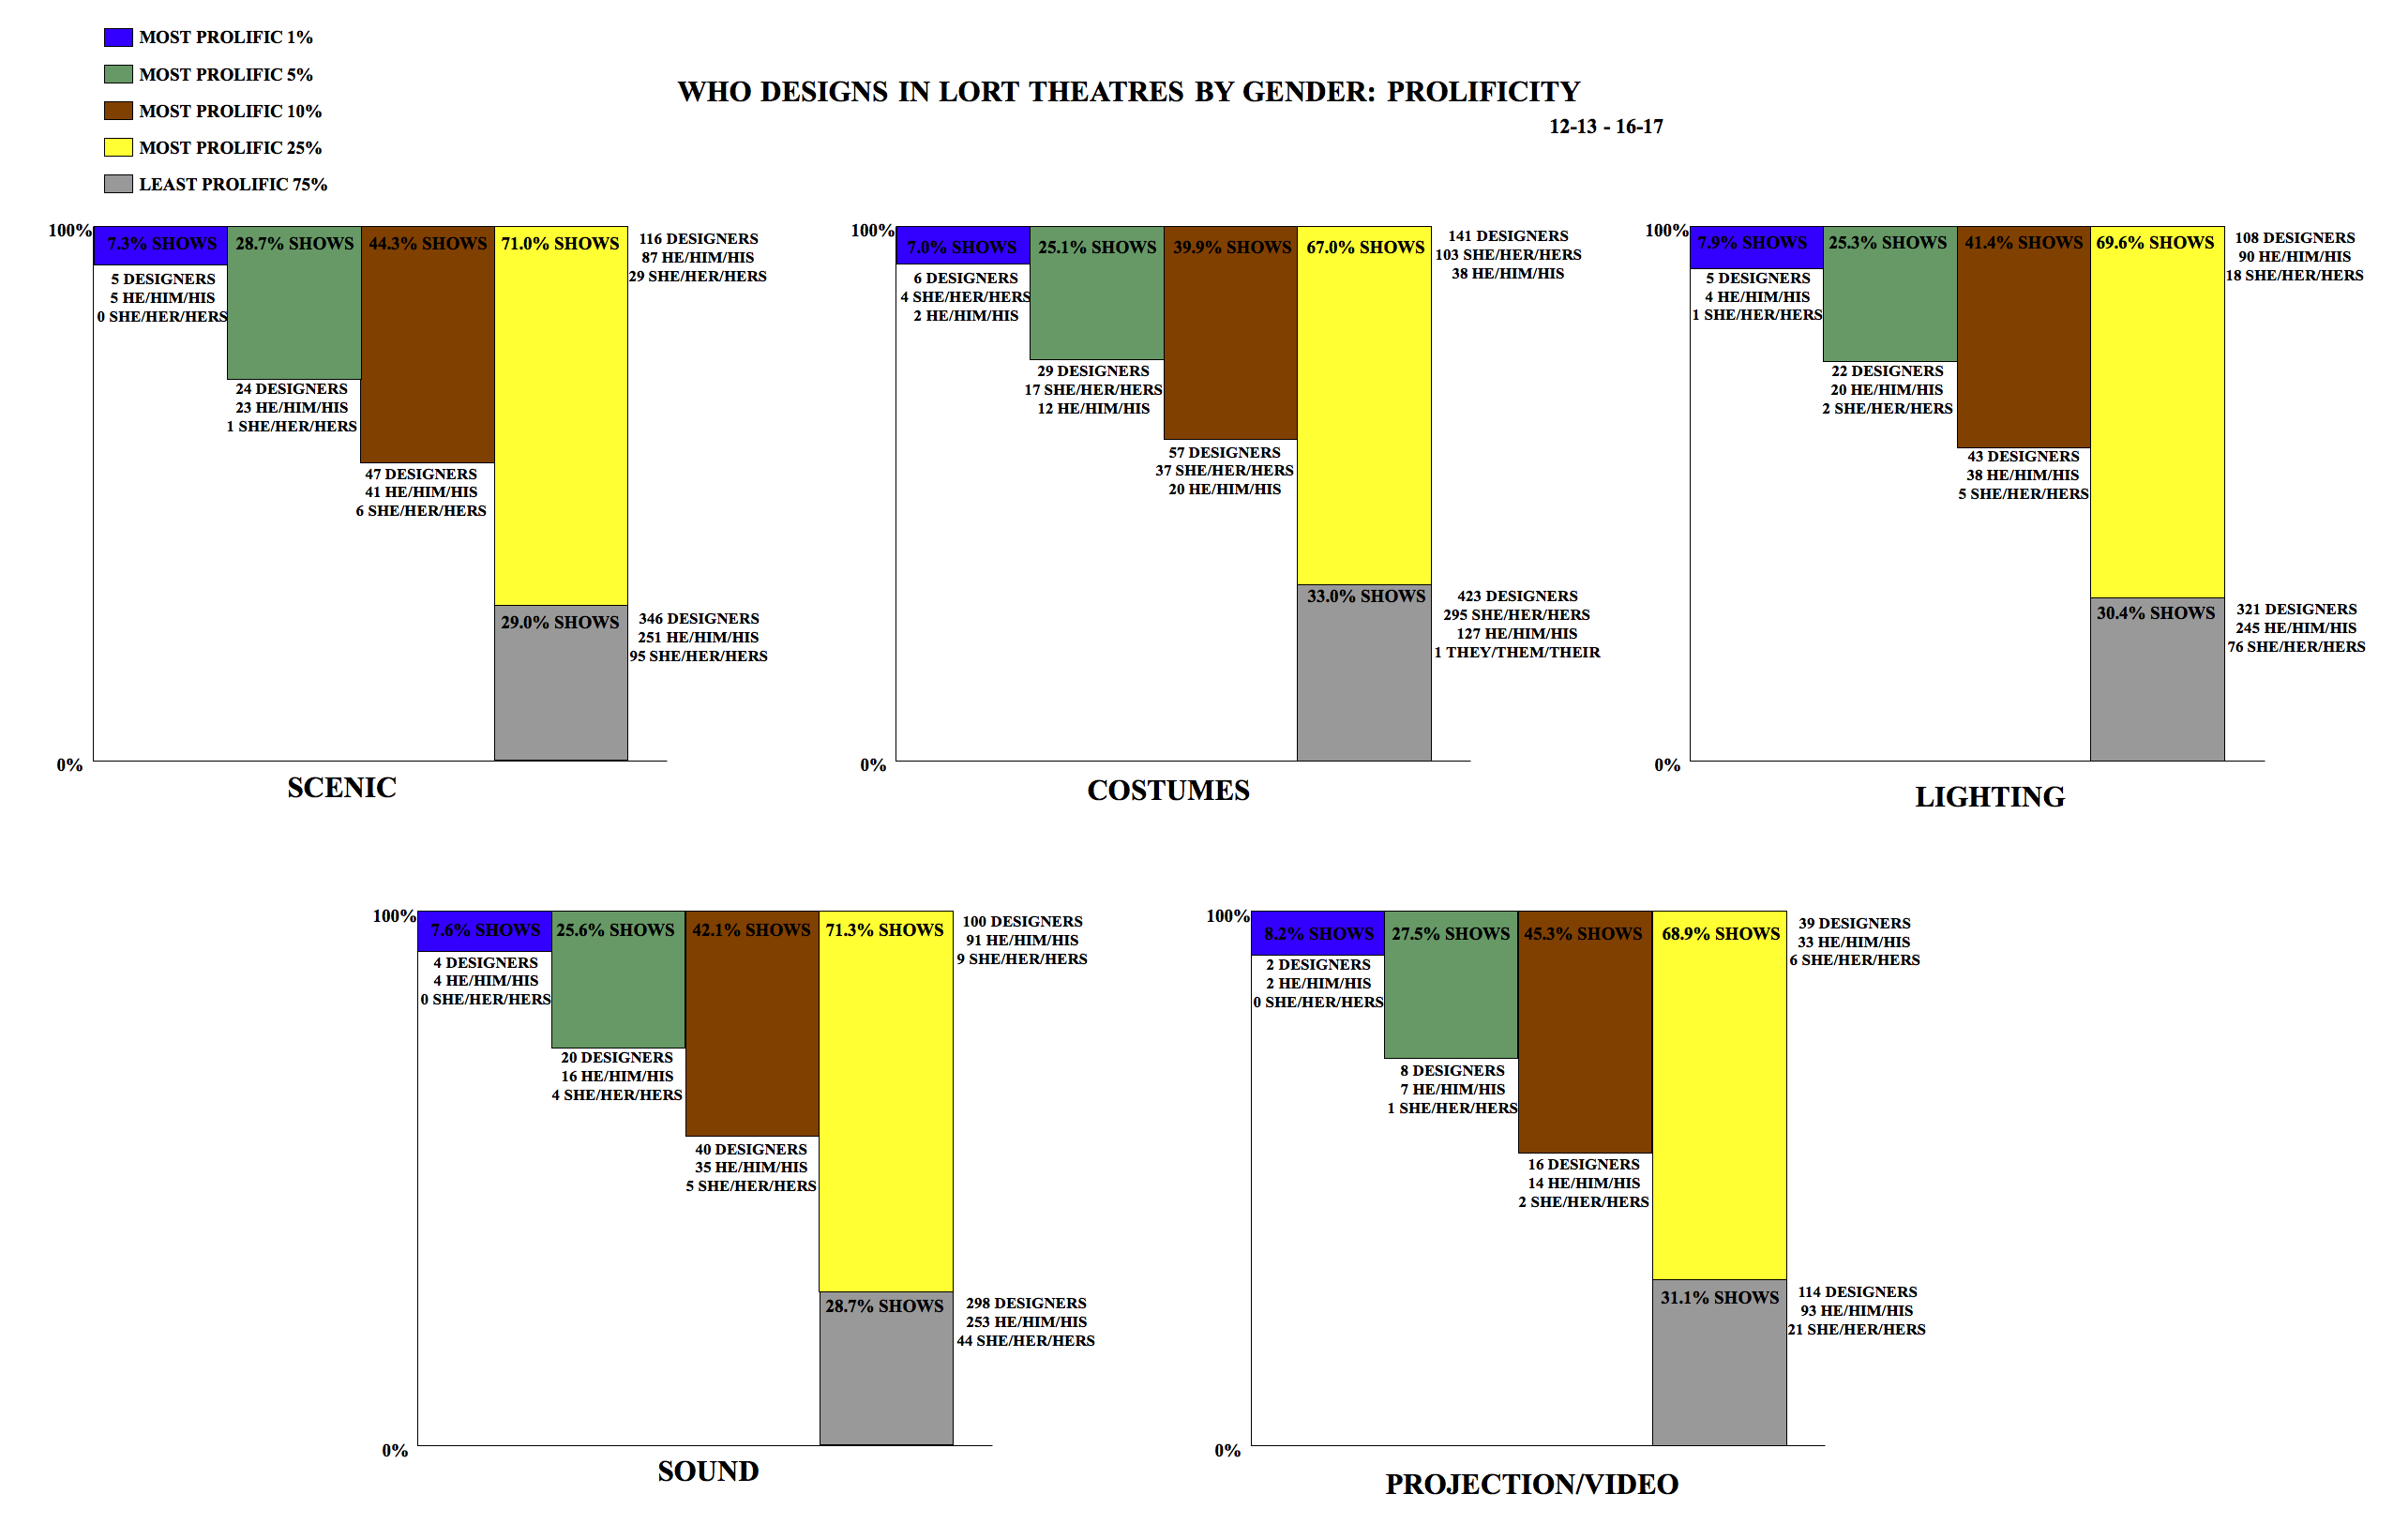
The fourth phase of this study adds a few additional ways of looking at the data to more fully explore the gender statistics of designers, directors, and artistic directors working at LORT member theatres. To begin, I added the 2016-17 and 2017 production seasons to the overall data. Instead of using male and female to refer to gender, I’m using the pronouns I found. I changed the look of the prolificity graphs for clarity. Now with five seasons to analyze, I looked at yearly percentages of positions by region and category. Please note that some of the yearly percentages are based on very small numbers of positions, particularly in the projection/video design discipline. I examined all he designer and all she designer teams, and how they correlate with gender identity of the director and artistic director. I also looked at seasons and theatres with no designers or directors of either she or he, based on which had the lower percentage overall. I’m narrating all the charts, after being called out on my own ableism, and I apologize for that in prior phases of this study.
Of the then seventy-three LORT member theatres, based on prior years’ and this year’s confirmation, 93.9 percent of the 2622 productions were confirmed. All the graphs are based on both confirmed and unconfirmed information. In the case of one theatre, the “head” of the theatre is an executive director rather than an artistic director, so that’s the information I used for the statistics. I rounded to one decimal point, which resulted in some graphs not equaling 100.0 percent exactly.
If you work at one of these theatres and would like your company’s specific raw data, please write me at [email protected] from your institutional email, and I’ll happily send it to you. Please allow a week for a response.
Thank you to all who confirmed data for this study over the last four years. This may end up being the last year of the study for me. It had been my pleasure and I wish you all happy seasons. And thank you to all the supporters of the study. A special thank you to all my editors at HowlRound over the years for their kind and smart guidance.


Comments
The article is just the start of the conversation—we want to know what you think about this subject, too! HowlRound is a space for knowledge-sharing, and we welcome spirited, thoughtful, and on-topic dialogue. Find our full comments policy here
I have been following your study and statistics. Your work is greatly appreciated. It is disappointing, to say the least, that these percentages vary little over the five years.My particular research involves the path/journey women designers (with a focus on scenic designers) have taken. Those that have designed for Broadway and those who are designing in our regional theatres. Like others, I am wondering where our numbers are and what specifically hinders or enhances the scaling of the design ladder.